Results
Model results
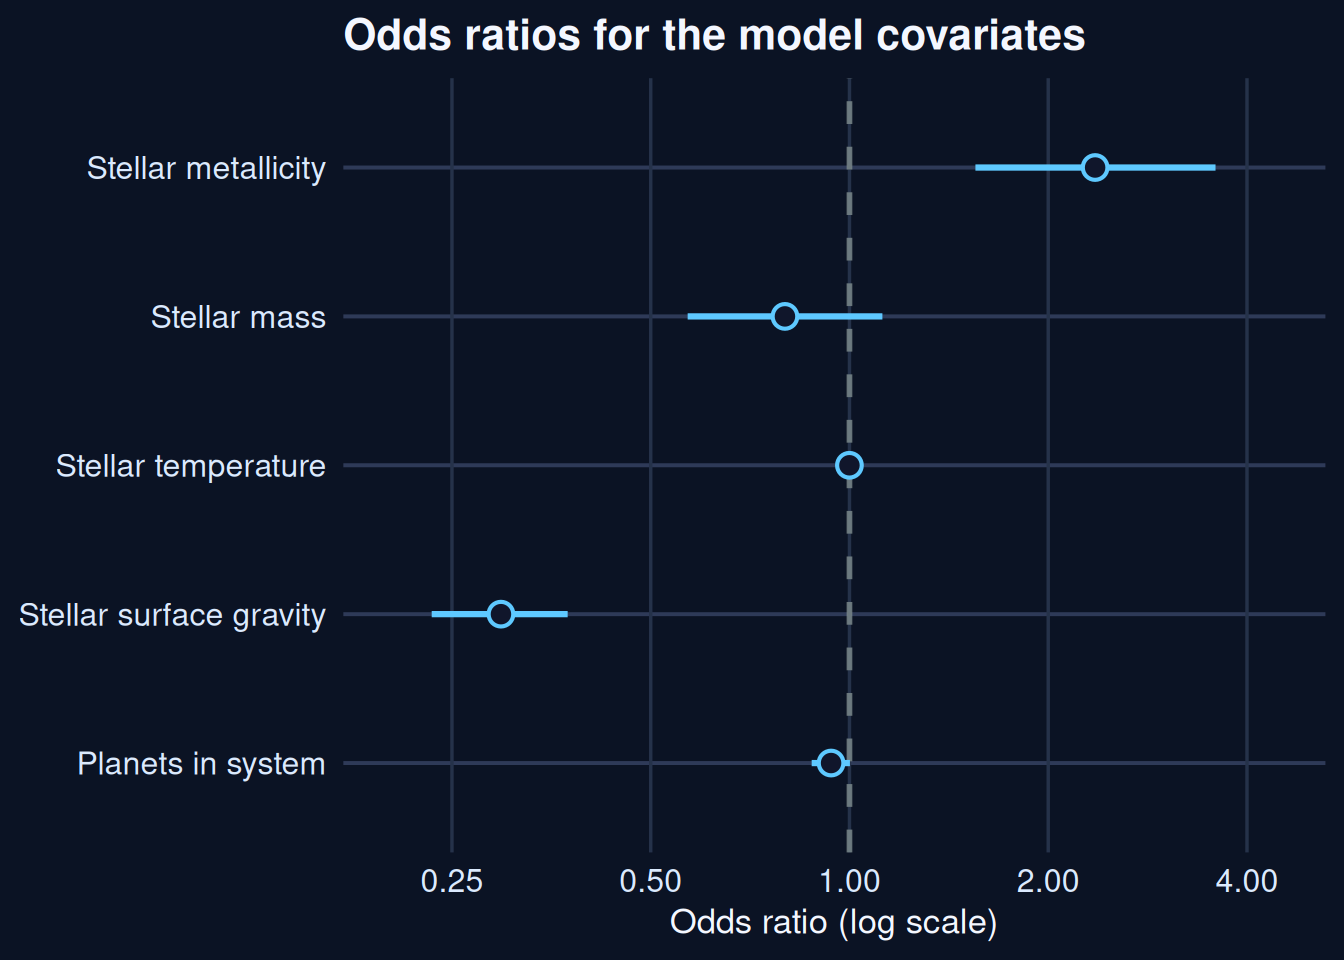
Effect estimates
- Metal-rich stars were more likely to host planets with eccentric orbits in this dataset. In practical terms, moving up in metallicity was linked to a noticeably higher chance of eccentricity.
- Stars with higher surface gravity were less likely to be linked with eccentric orbits, suggesting those systems may be dynamically calmer.
- Because these two star properties are measurable early, they can help prioritize which systems deserve closer follow-up.
The figure below shows which inputs push predictions toward eccentric or circular outcomes. Points above 1 mean a variable tends to raise the chance of eccentricity; points below 1 mean it tends to lower it. The horizontal bars show uncertainty, so wider bars mean less confidence in the exact effect size.
Metallicity and surface gravity were the clearest predictors in this model.
Prediction quality
The next figures focus on how the model separates the two classes and how well it performs on the held-out test set. In this setting, the precision-recall curve is especially informative because it highlights the balance between recovering genuinely eccentric systems and avoiding a large number of false alarms.
This precision-recall curve shows the trade-off between catching more eccentric planets and making more false alarms.
- AUPRC (area under the precision-recall curve) is 0.35. It summarizes the whole curve into one score: higher means the model keeps true detections high while limiting false positives across many thresholds.
- Why AUPRC matters here: eccentric planets are the minority class, so AUPRC is more informative than accuracy alone for judging whether the model is truly useful for discovery.
- The dashed baseline (23.2%) is what you would expect from random guessing at the class prevalence. Performance above that line means the model is adding real signal.
- At threshold 0.26, precision is 40.8% and recall is 26.1%: the model finds some eccentric systems, but misses many and still raises false alarms.
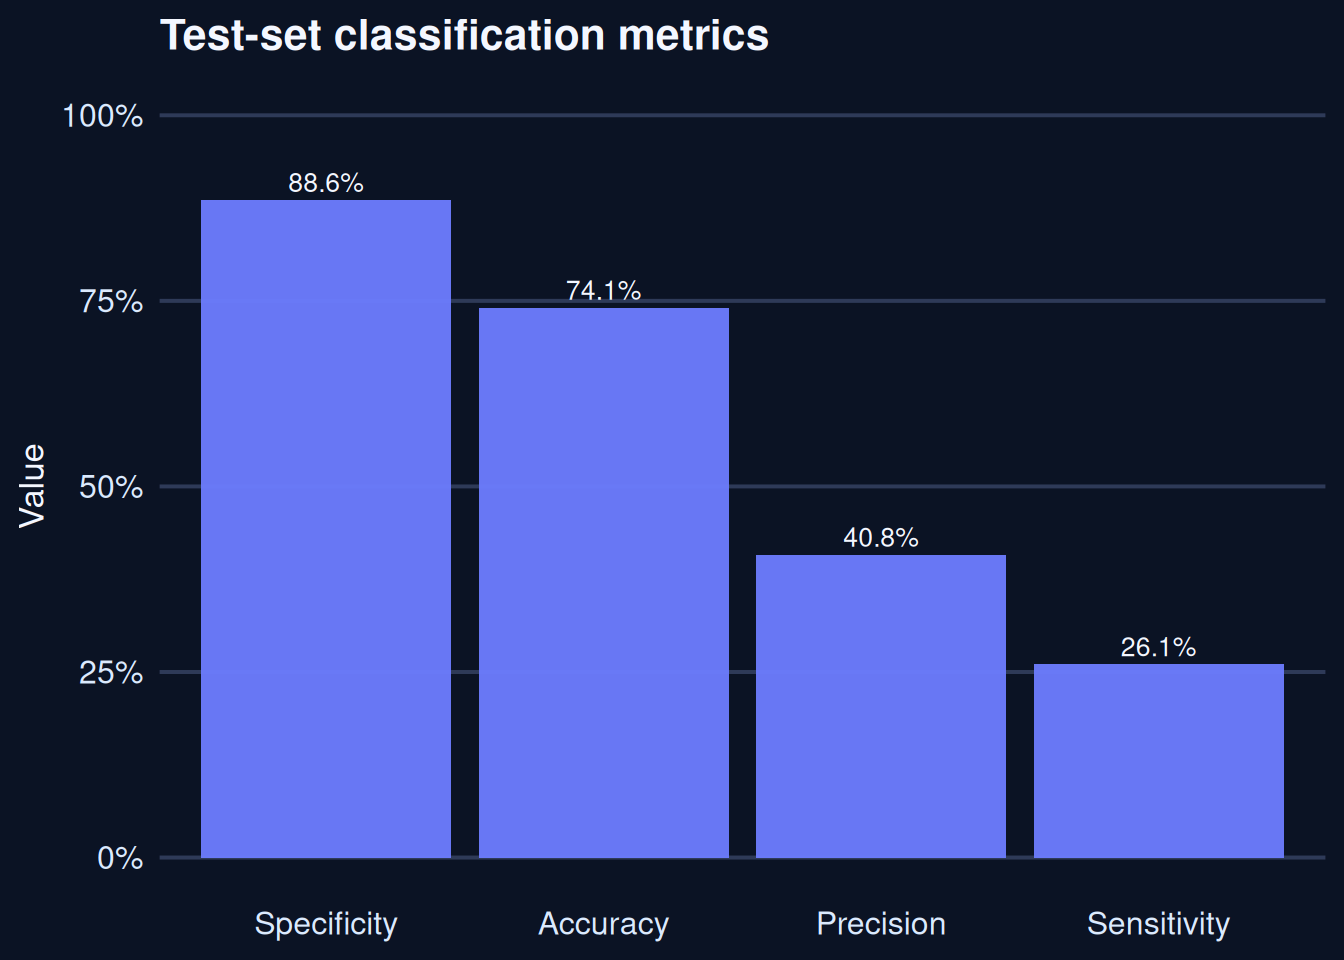
This bar chart gives four different views of model quality, each answering a different practical question.
- Accuracy asks: how often is the model correct overall? This can look better than the model really is when one class is much more common.
- Precision asks: when the model flags an eccentric orbit, how often is that flag correct?
- Sensitivity (recall) asks: out of truly eccentric systems, how many did the model successfully catch?
- Specificity asks: out of truly circular systems, how many did the model correctly leave unflagged?
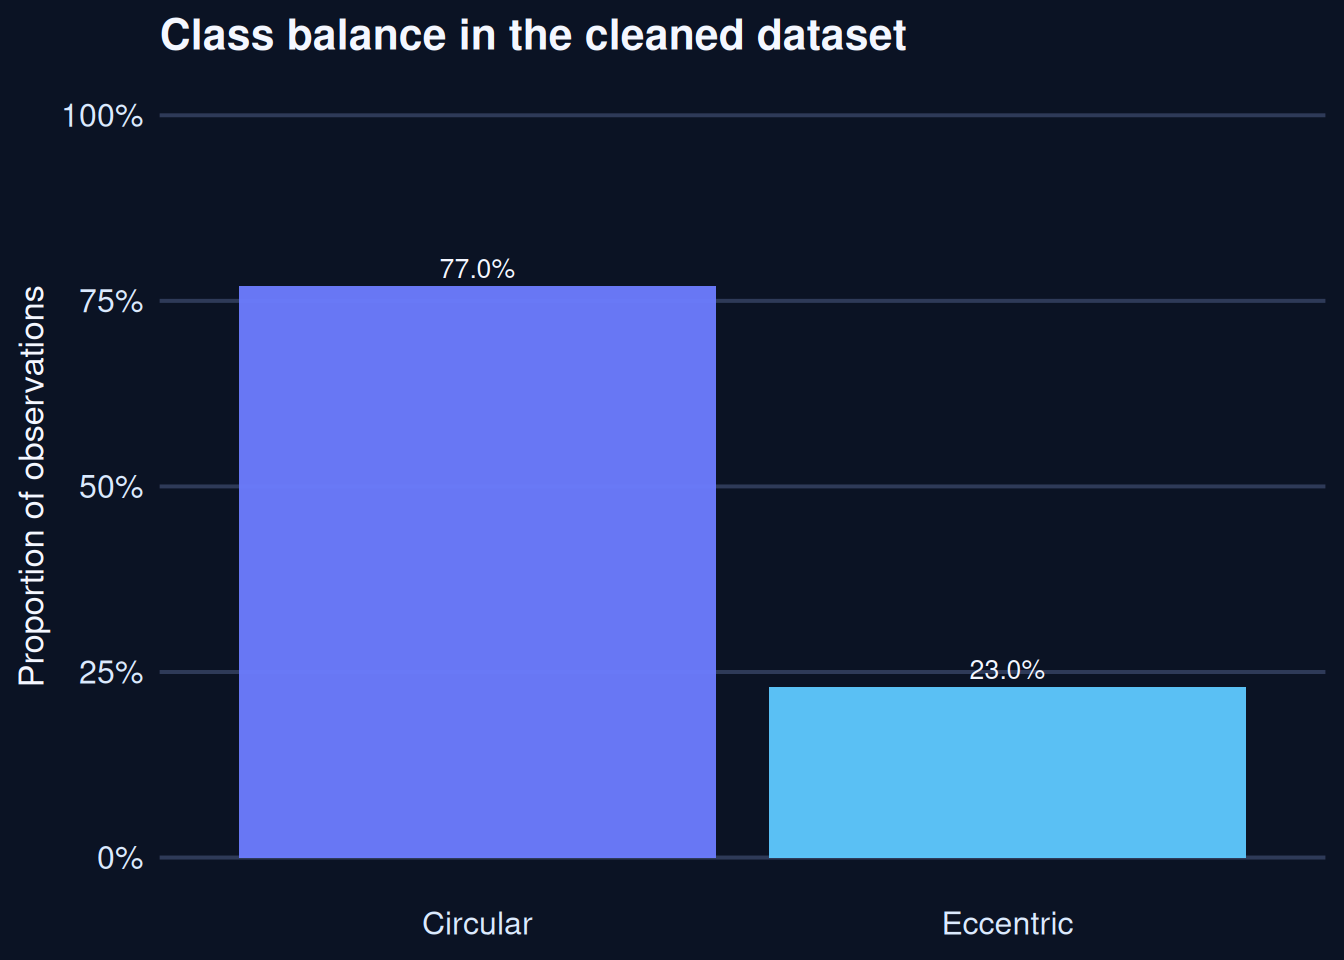
In the cleaned dataset, circular orbits are much more common (77.0%).
- The model therefore sees many more circular examples during training.
- As a result, performance can look strong even when many of the rarer eccentric systems are still missed.
This density plot compares the predicted probabilities for circular and eccentric cases. A better separation between the two groups would show as two more distinct peaks.
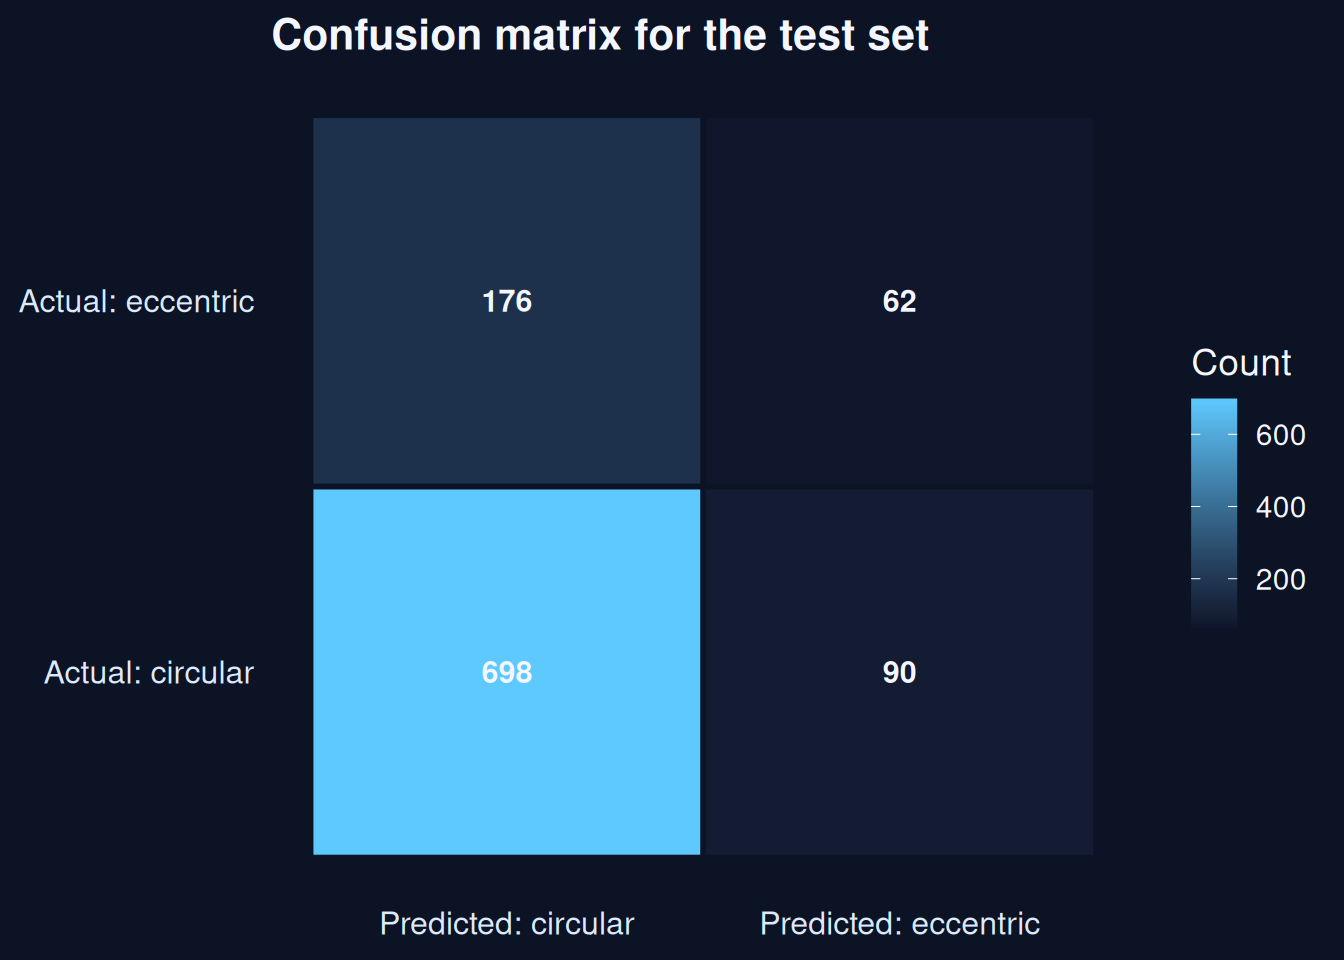
This confusion matrix is a direct count of right and wrong predictions in each class.
- Most circular systems are identified correctly, but many eccentric systems are still missed.
- For a screening tool, missed eccentric systems reduce discovery value, while false alarms increase costly follow-up work.
Conclusion
Key takeaways
- Stellar metallicity and surface gravity stand out as the strongest predictors in the model.
- A plausible explanation is that metallicity reflects the chemical enrichment of the protoplanetary disk, which may influence how planets form and how dynamically complex their orbits become.
- Surface gravity may proxy for stellar structure and evolutionary context, which can shape the broader architecture of the system in ways that affect orbital eccentricity.
- The results suggest that basic star-system measurements provide useful information, but they do not fully determine eccentricity.
- This is unsurprising, because orbital eccentricity is also governed by dynamical processes such as planet-planet scattering, secular perturbations, and migration history.
Limitations of the dataset and study
- The analysis relies on a relatively small and observationally derived dataset, so the conclusions should be viewed as suggestive rather than definitive.
- The binary outcome is a simplification of a continuous physical phenomenon; some systems near the threshold may be classified somewhat arbitrarily.
- The model uses only a small set of host-star and system variables, and it does not include other potentially important drivers such as orbital architecture, age, migration history, or planet size.
- Selection effects in exoplanet surveys may bias the sample toward systems that are easier to detect, which can influence the apparent relationships between stellar properties and orbital eccentricity.